
Getting Started Walkthrough
With your account created and a collector connected, let’s get real devices into GridNMS and set up your first alert. This same walkthrough applies to self-hosted instances too.
Set up your monitoring before you add devices, and every device you discover starts polling correctly the moment you assign it a class. The order is: install packs → get your classes right → add credentials → discover devices.
1. Install monitoring packs
Section titled “1. Install monitoring packs”A monitoring pack defines what GridNMS collects from a device (interface traffic, CPU, memory, environment, and so on) and how it’s shown. GridNMS ships with core packs plus vendor bundles for Cisco, Juniper, Fortinet, Aruba, APC, and more.
- Go to Configure → Monitoring Packs.
- Review what’s already installed. To add a vendor bundle, use Upload bundle (or Upload Pack for a single pack).
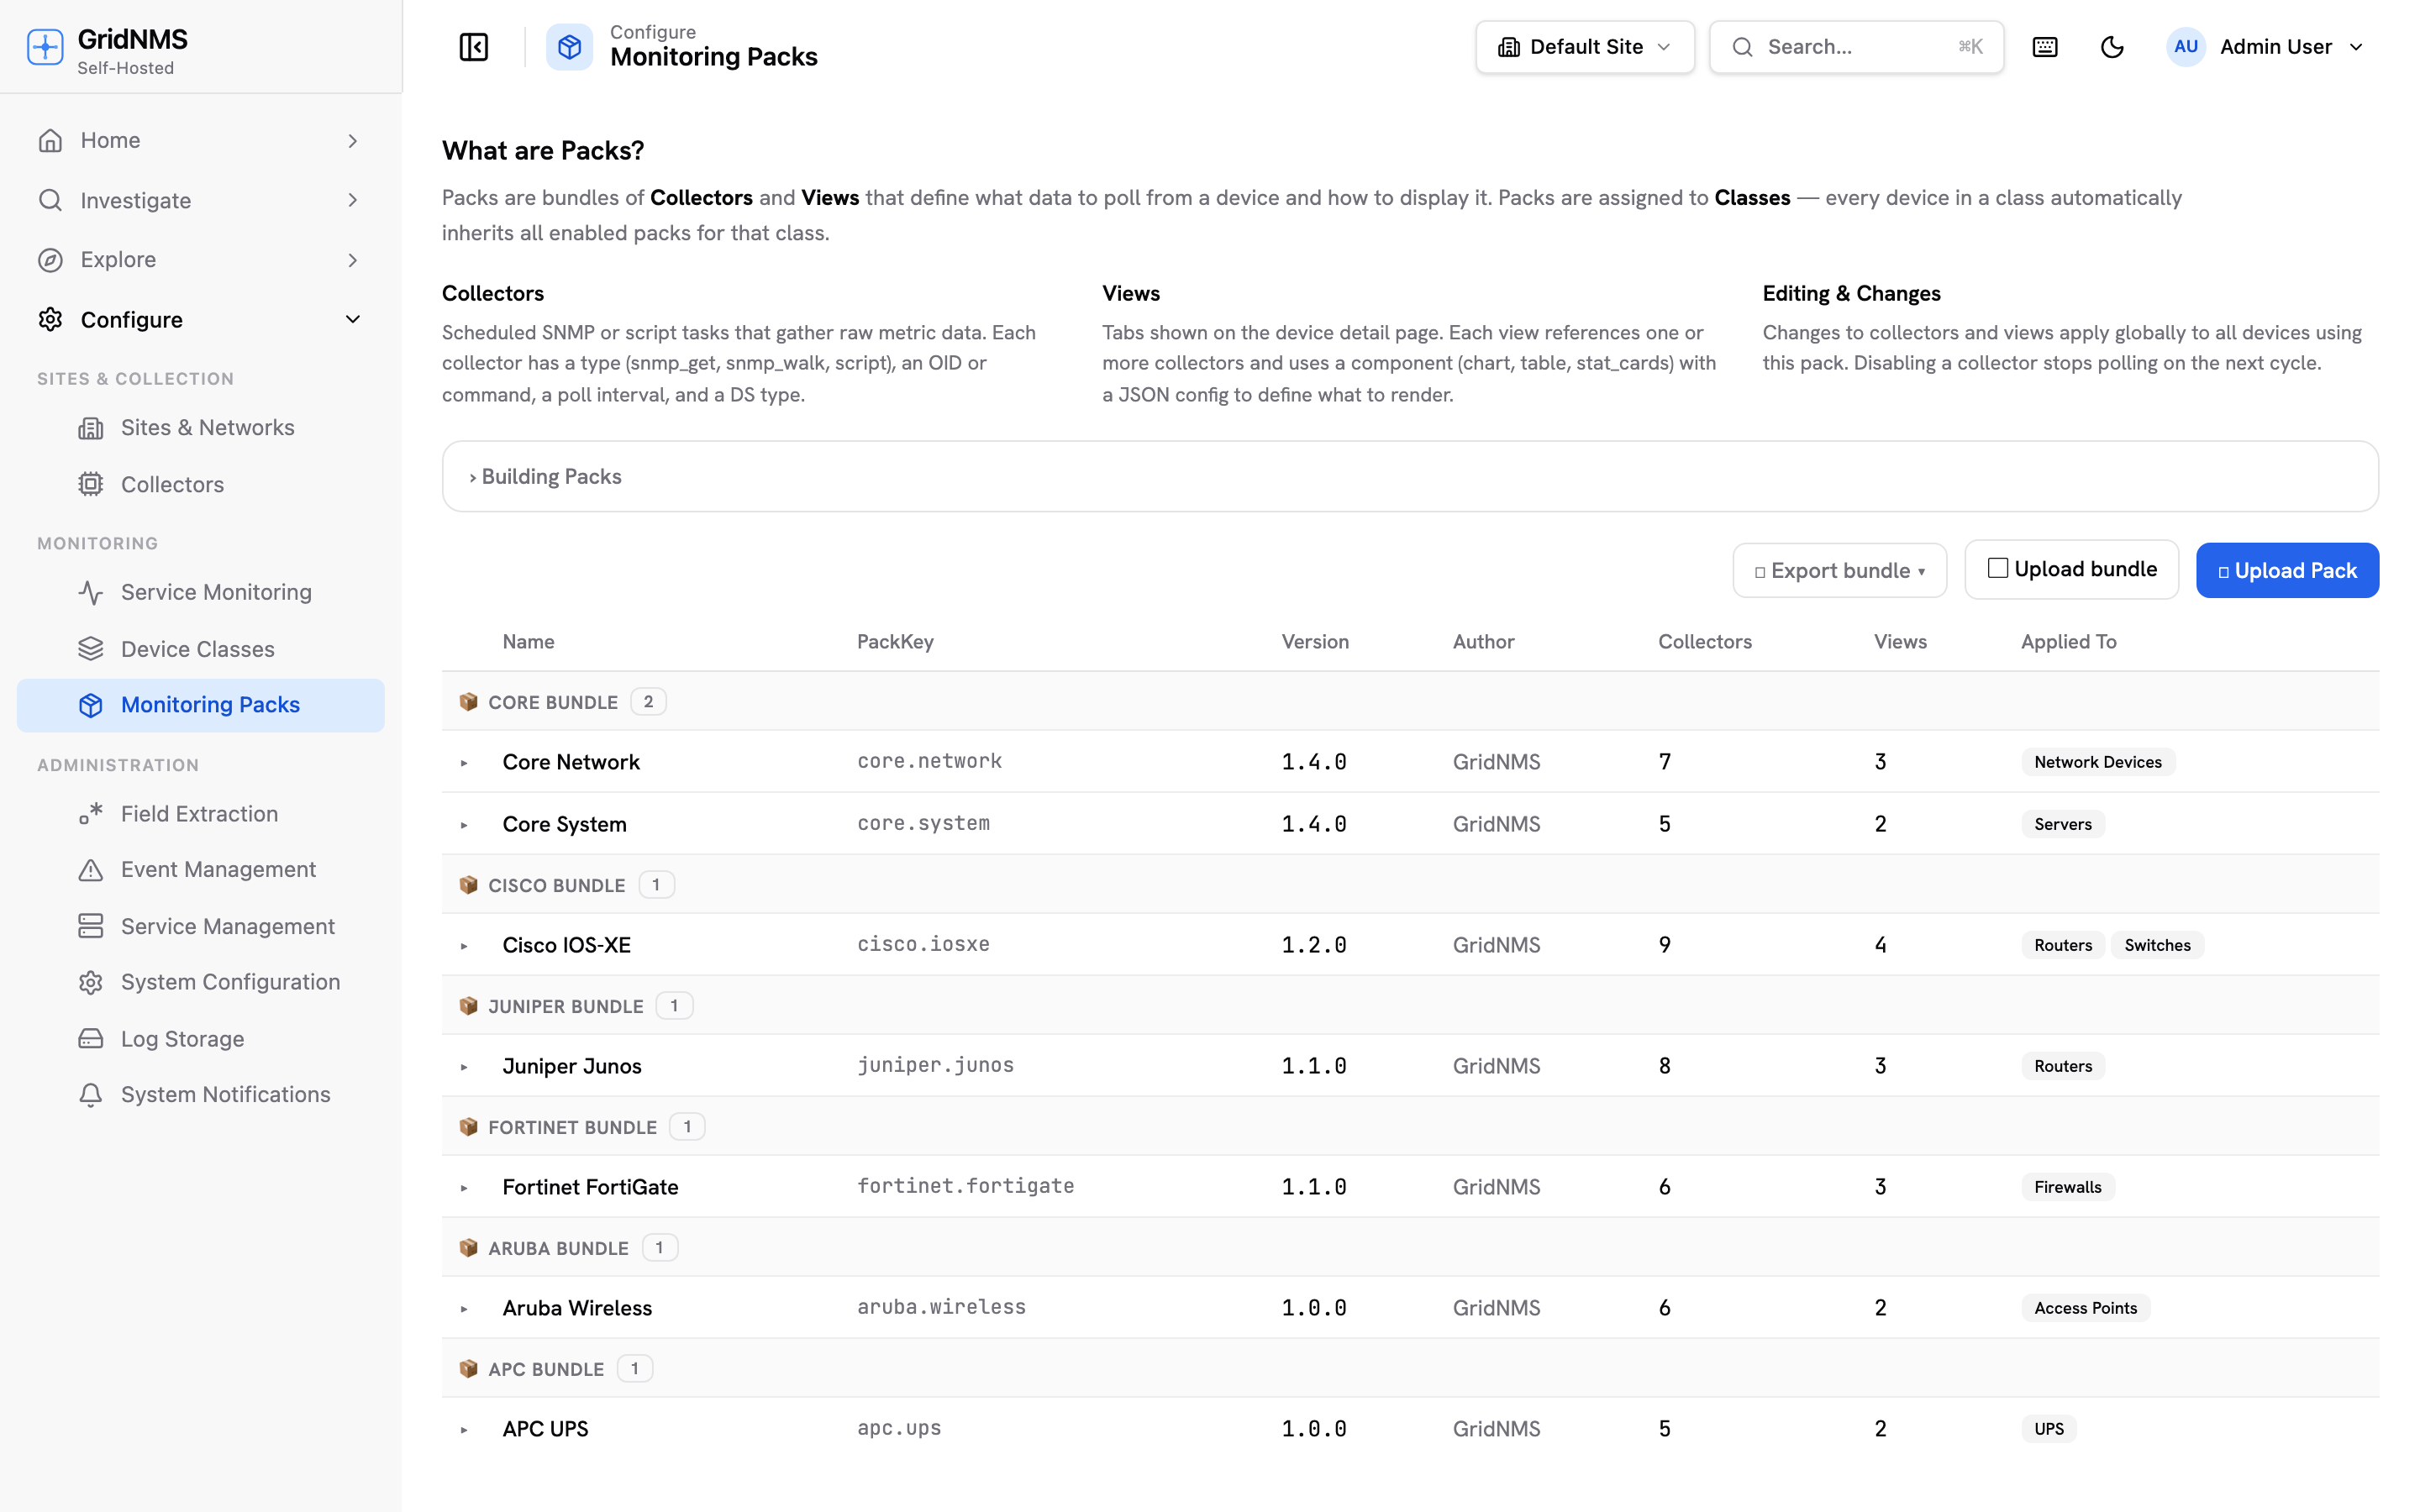 The Monitoring Packs page lists every installed pack and its collectors and views.
Full details: Monitoring Packs and Built-in Packs.
2. Set up your device classes
Section titled “2. Set up your device classes”A device class (Router, Switch, Firewall, Access Point, Server, …) is what tells GridNMS how to monitor a device: which packs run, which credentials to use, and which detail tabs appear. Classes are inherited, so you configure a type once and every device of that type is set up automatically.
- Go to Configure → Device Classes.
- Adjust the built-in classes to fit your gear, or create new classes for device types you have.
- On each class, open the Packs tab and Apply Pack to attach the packs that class should collect.
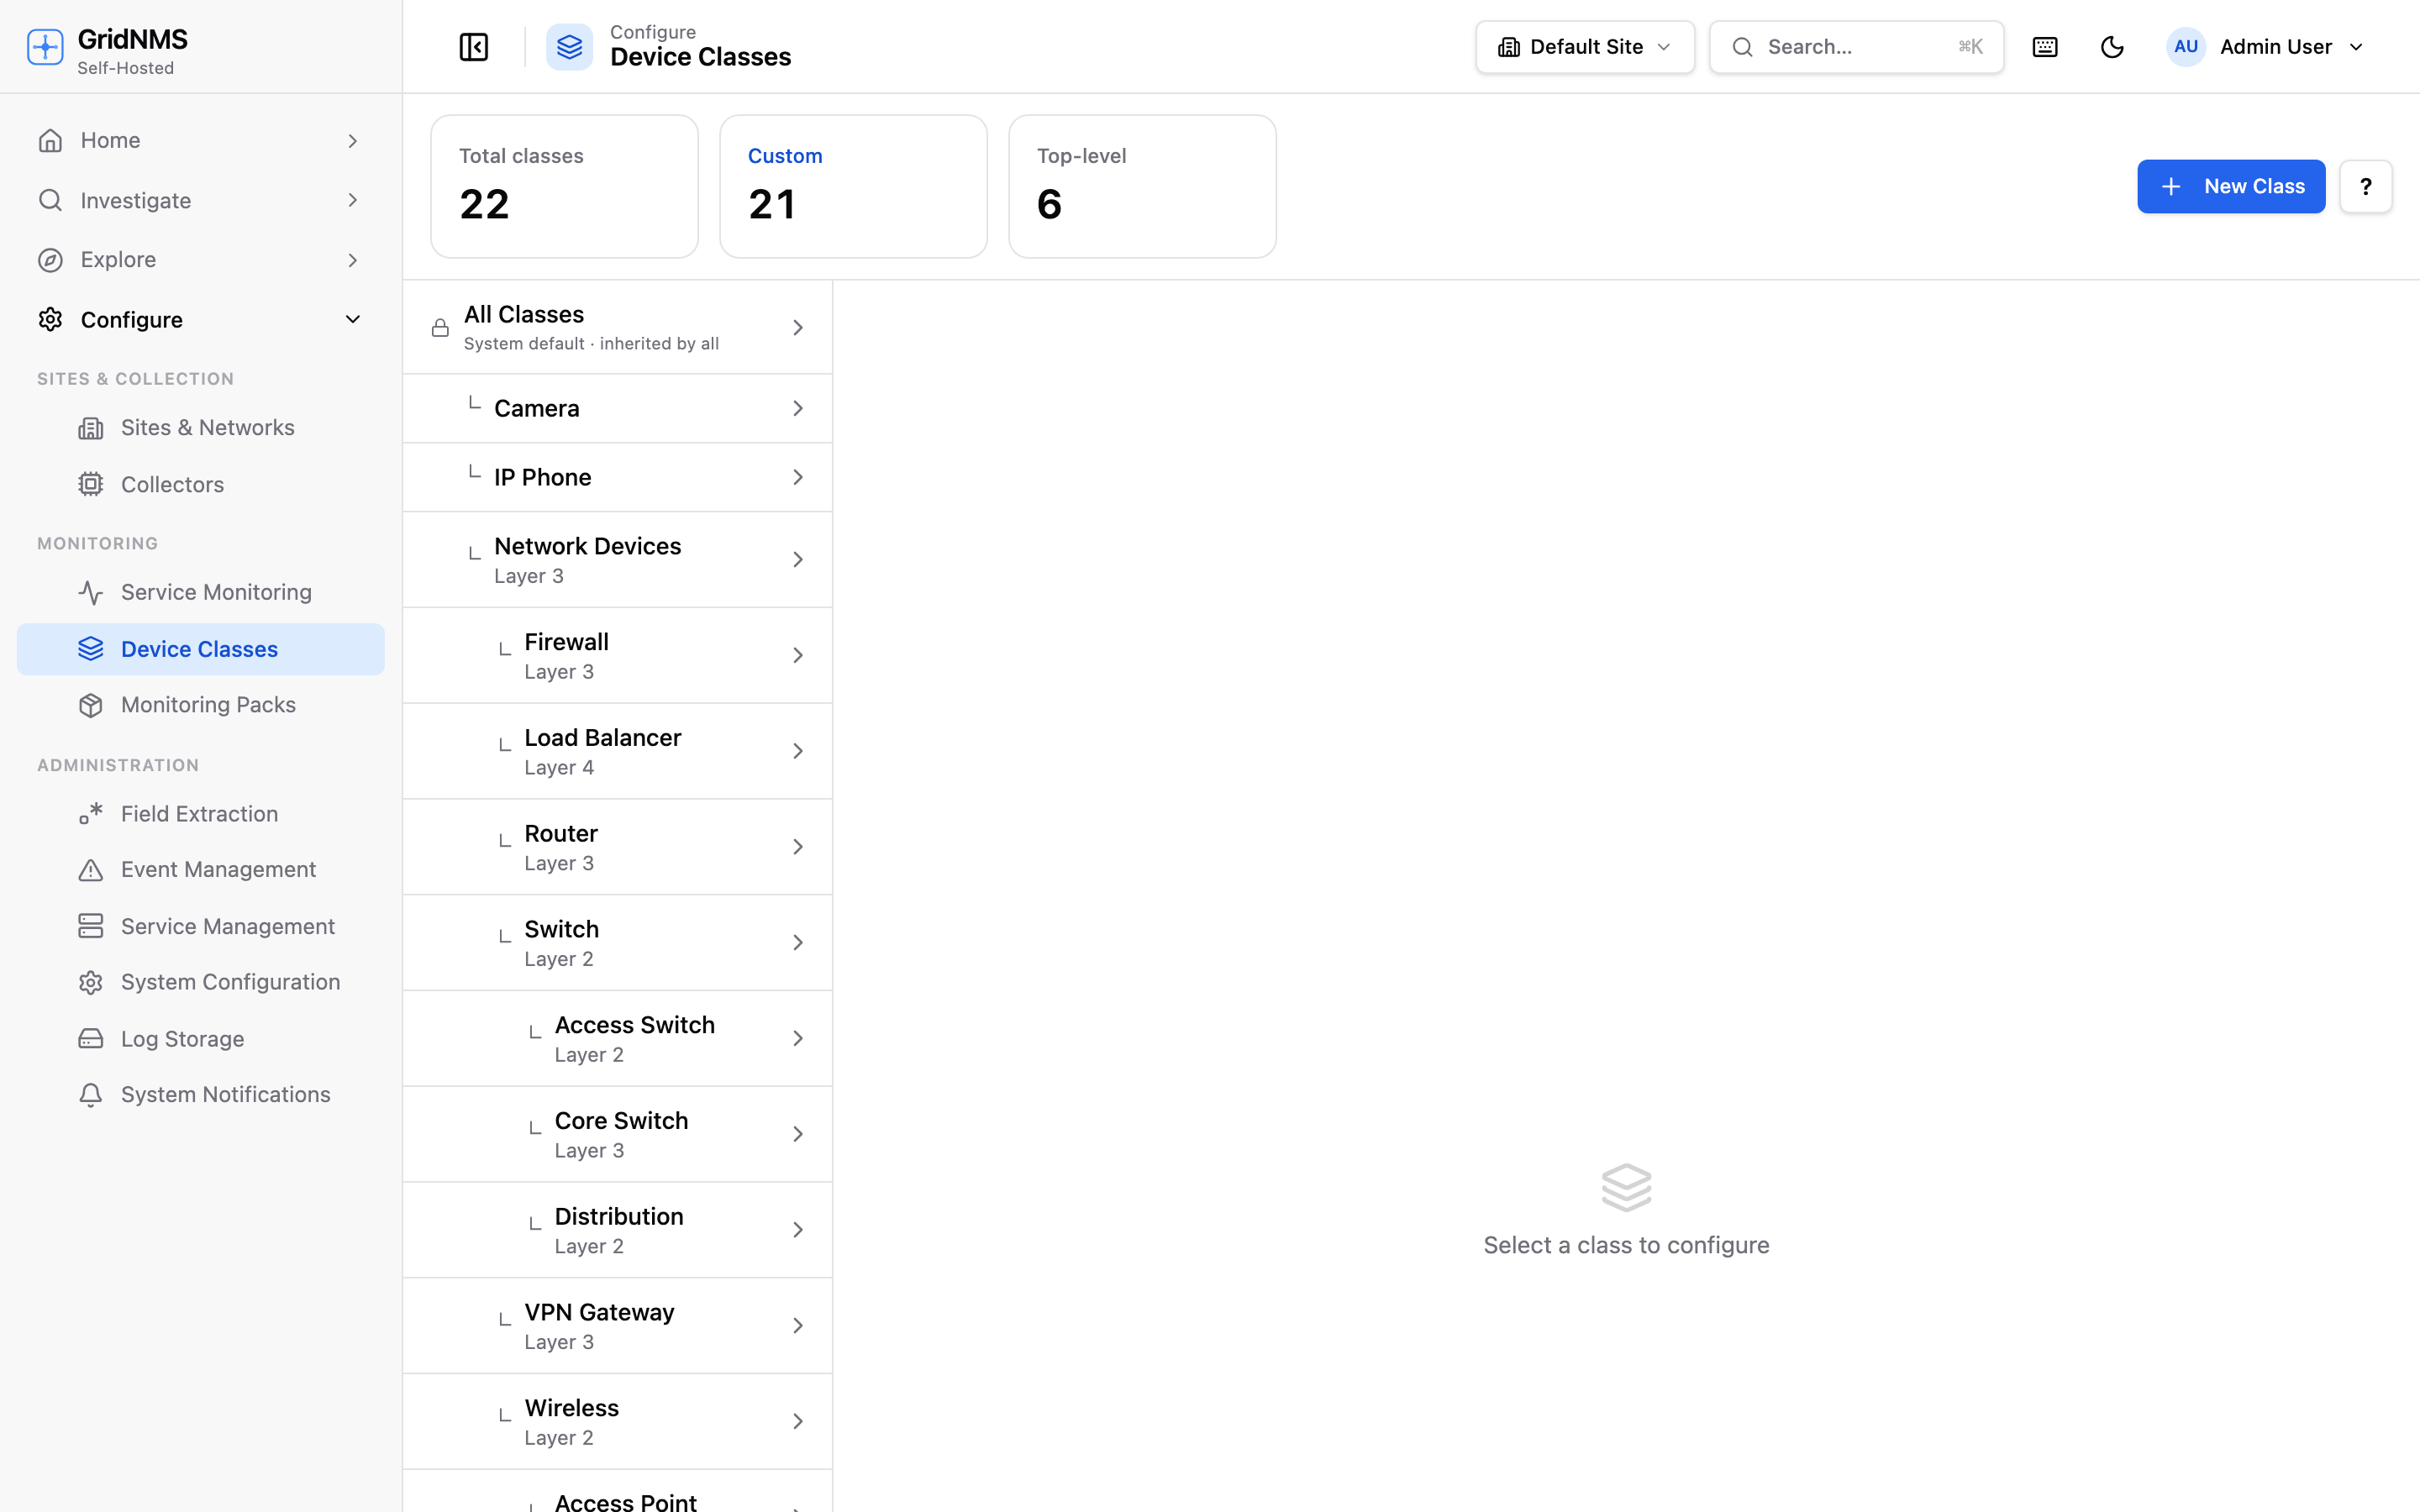 Pick a class, then configure its packs, credentials, and settings — every device in the class inherits them.
Full details: Device Classes.
3. Add monitoring credentials
Section titled “3. Add monitoring credentials”To collect more than up/down status, give GridNMS read-only SNMP (and optionally SSH) credentials. Set them once on a device class so every device of that type inherits them (you can still override per device later). GridNMS then collects interface traffic, CPU, memory, and disk metrics automatically.
- In Configure → Device Classes, select a class.
- Enter its SNMP community/user (and SSH login, if used) and Save Settings.
See Device Classes and Devices & Inventory.
4. Discover your devices
Section titled “4. Discover your devices”With packs, classes, and credentials in place, populate your inventory with Network Discovery — GridNMS scans an IP range and finds what’s there.
- Go to Explore → Discovery.
- Enter a range to scan — a single IP, a CIDR (e.g.
10.0.0.0/24), or a dash range (e.g.10.0.0.1-10.0.0.50). - Pick an aggressiveness profile (Low is gentle and safe for production; High is faster and more thorough).
- Select Start scan and watch results stream in. GridNMS even guesses each device’s vendor and type.
- Tick the hosts you want, choose the correct class for them, and select Add to inventory. They immediately inherit that class’s packs and credentials and begin polling.
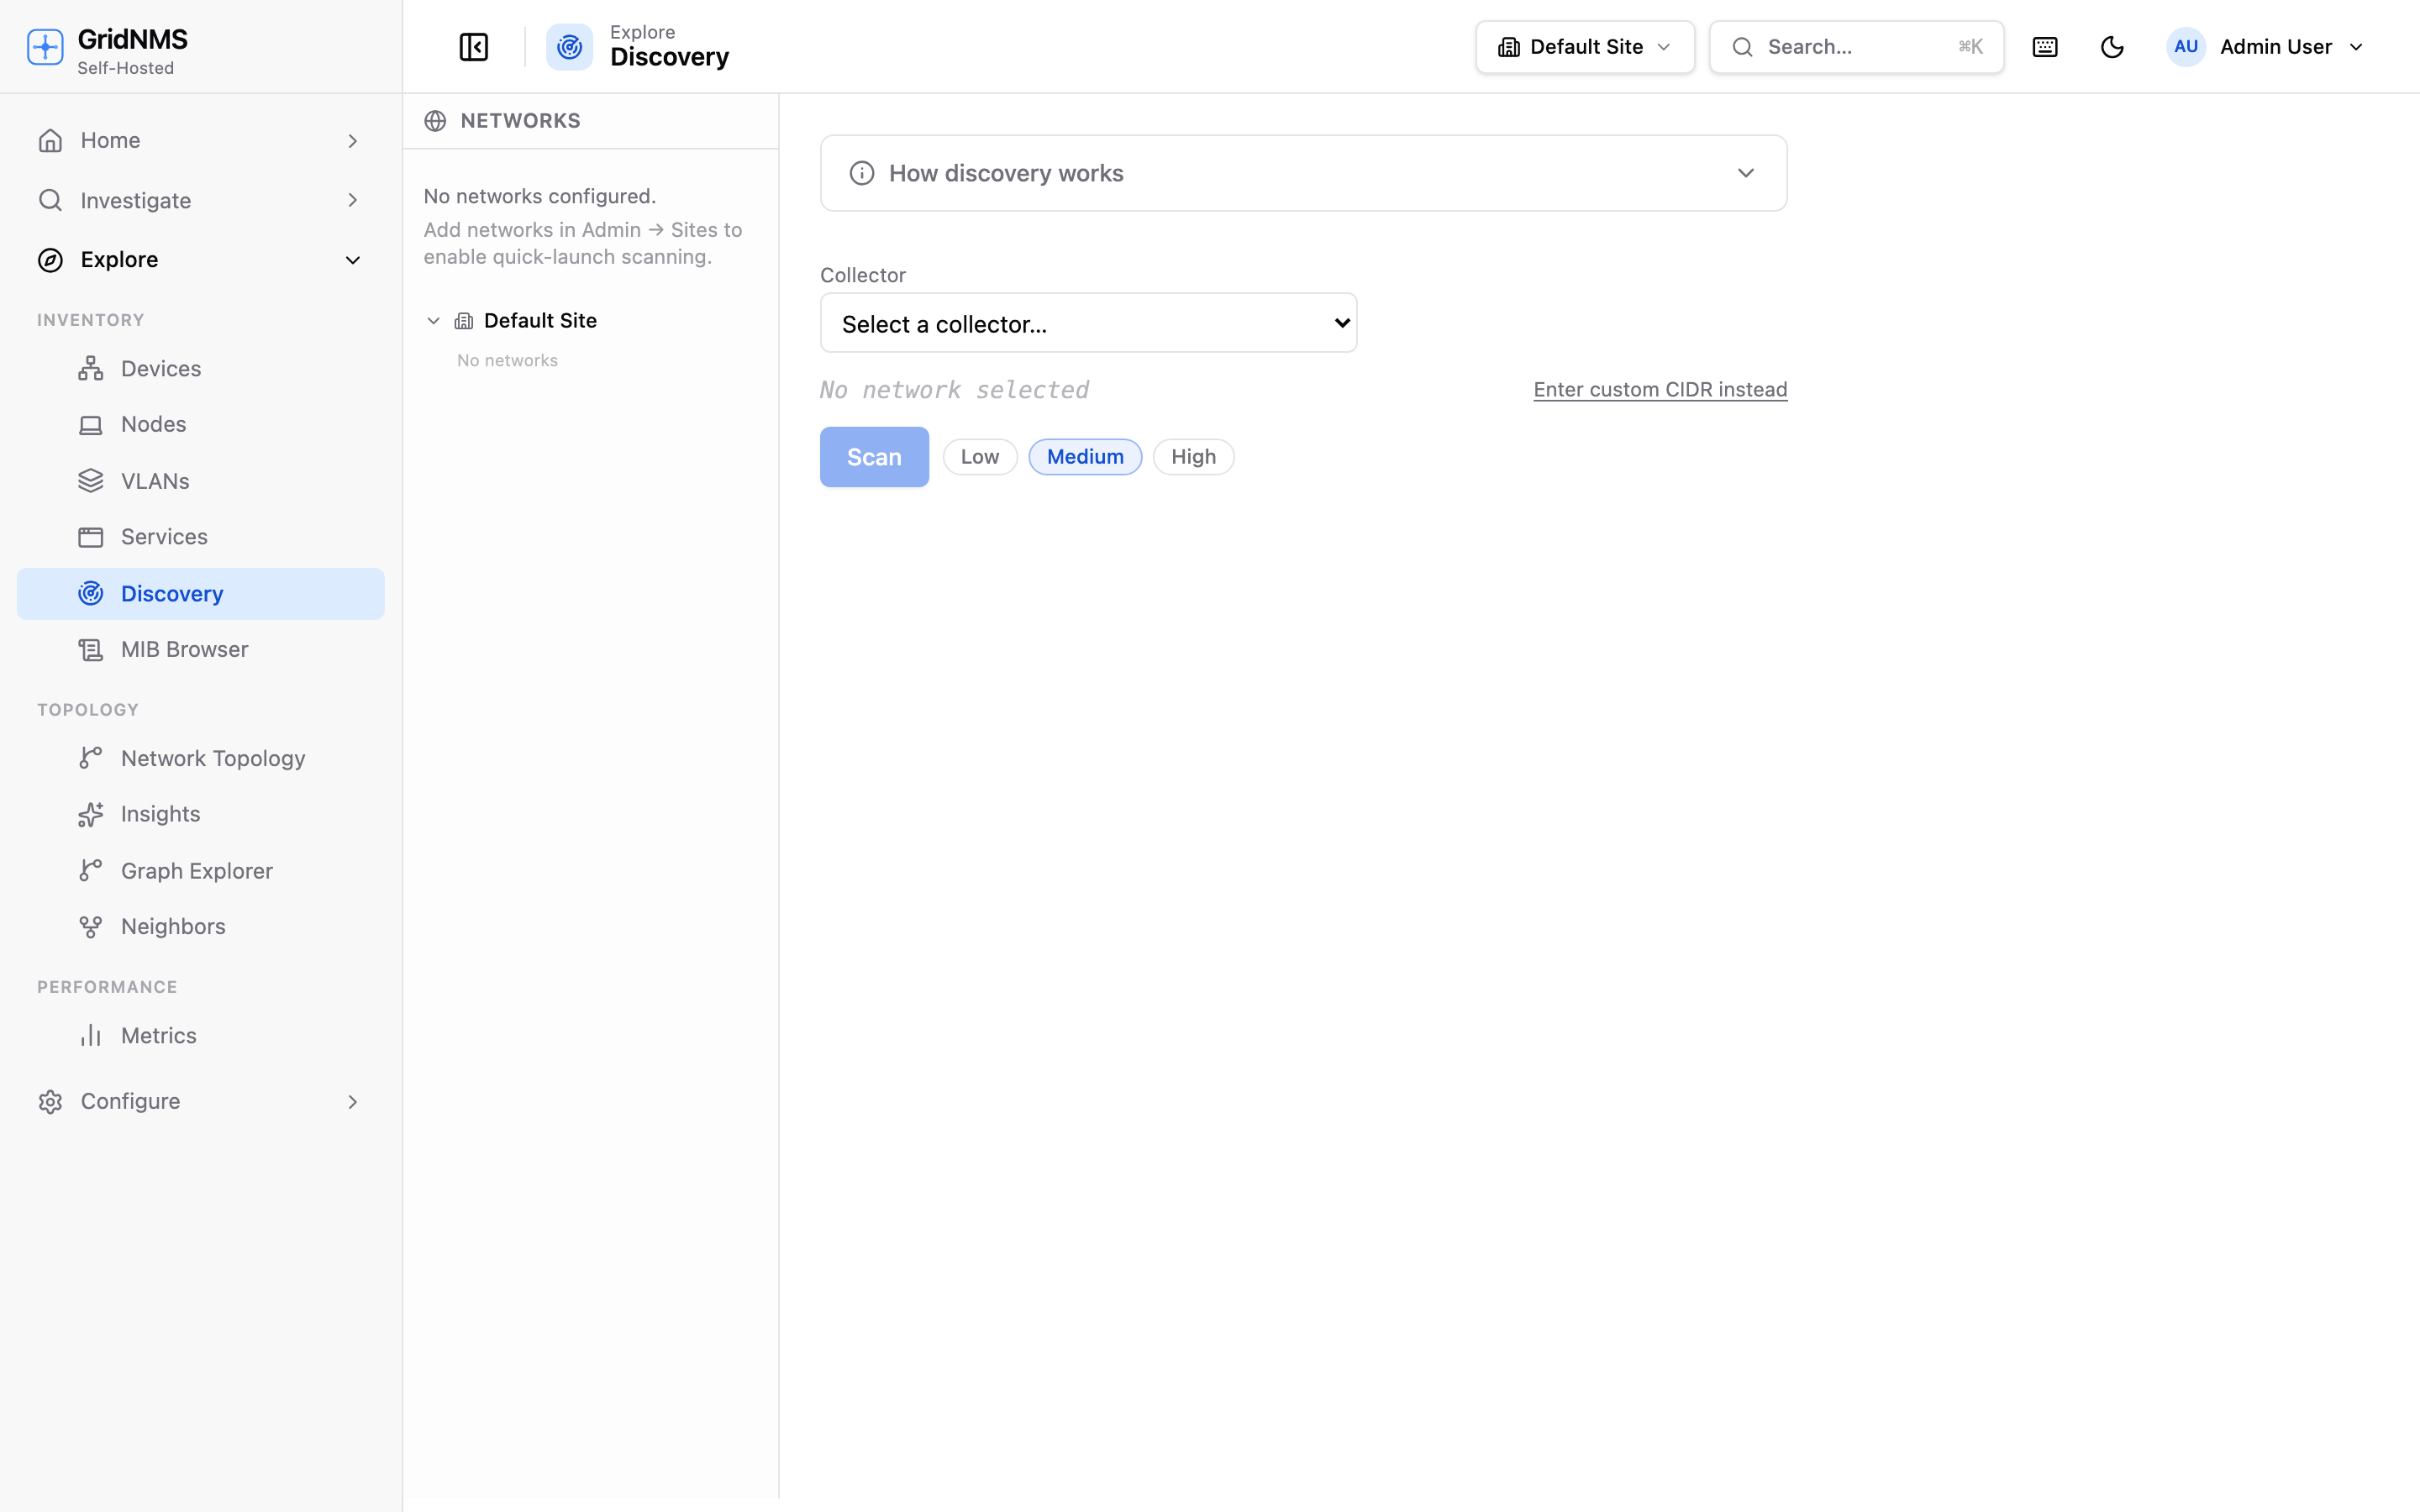 Discovery finds devices on your network and lets you add them in bulk with the right class.
Full details: Network Discovery.
5. Watch the dashboard come alive
Section titled “5. Watch the dashboard come alive”Open Home → Dashboard. Within a polling cycle you’ll see device status fill in, metrics start charting, and any problems appear in the Open Events panel.
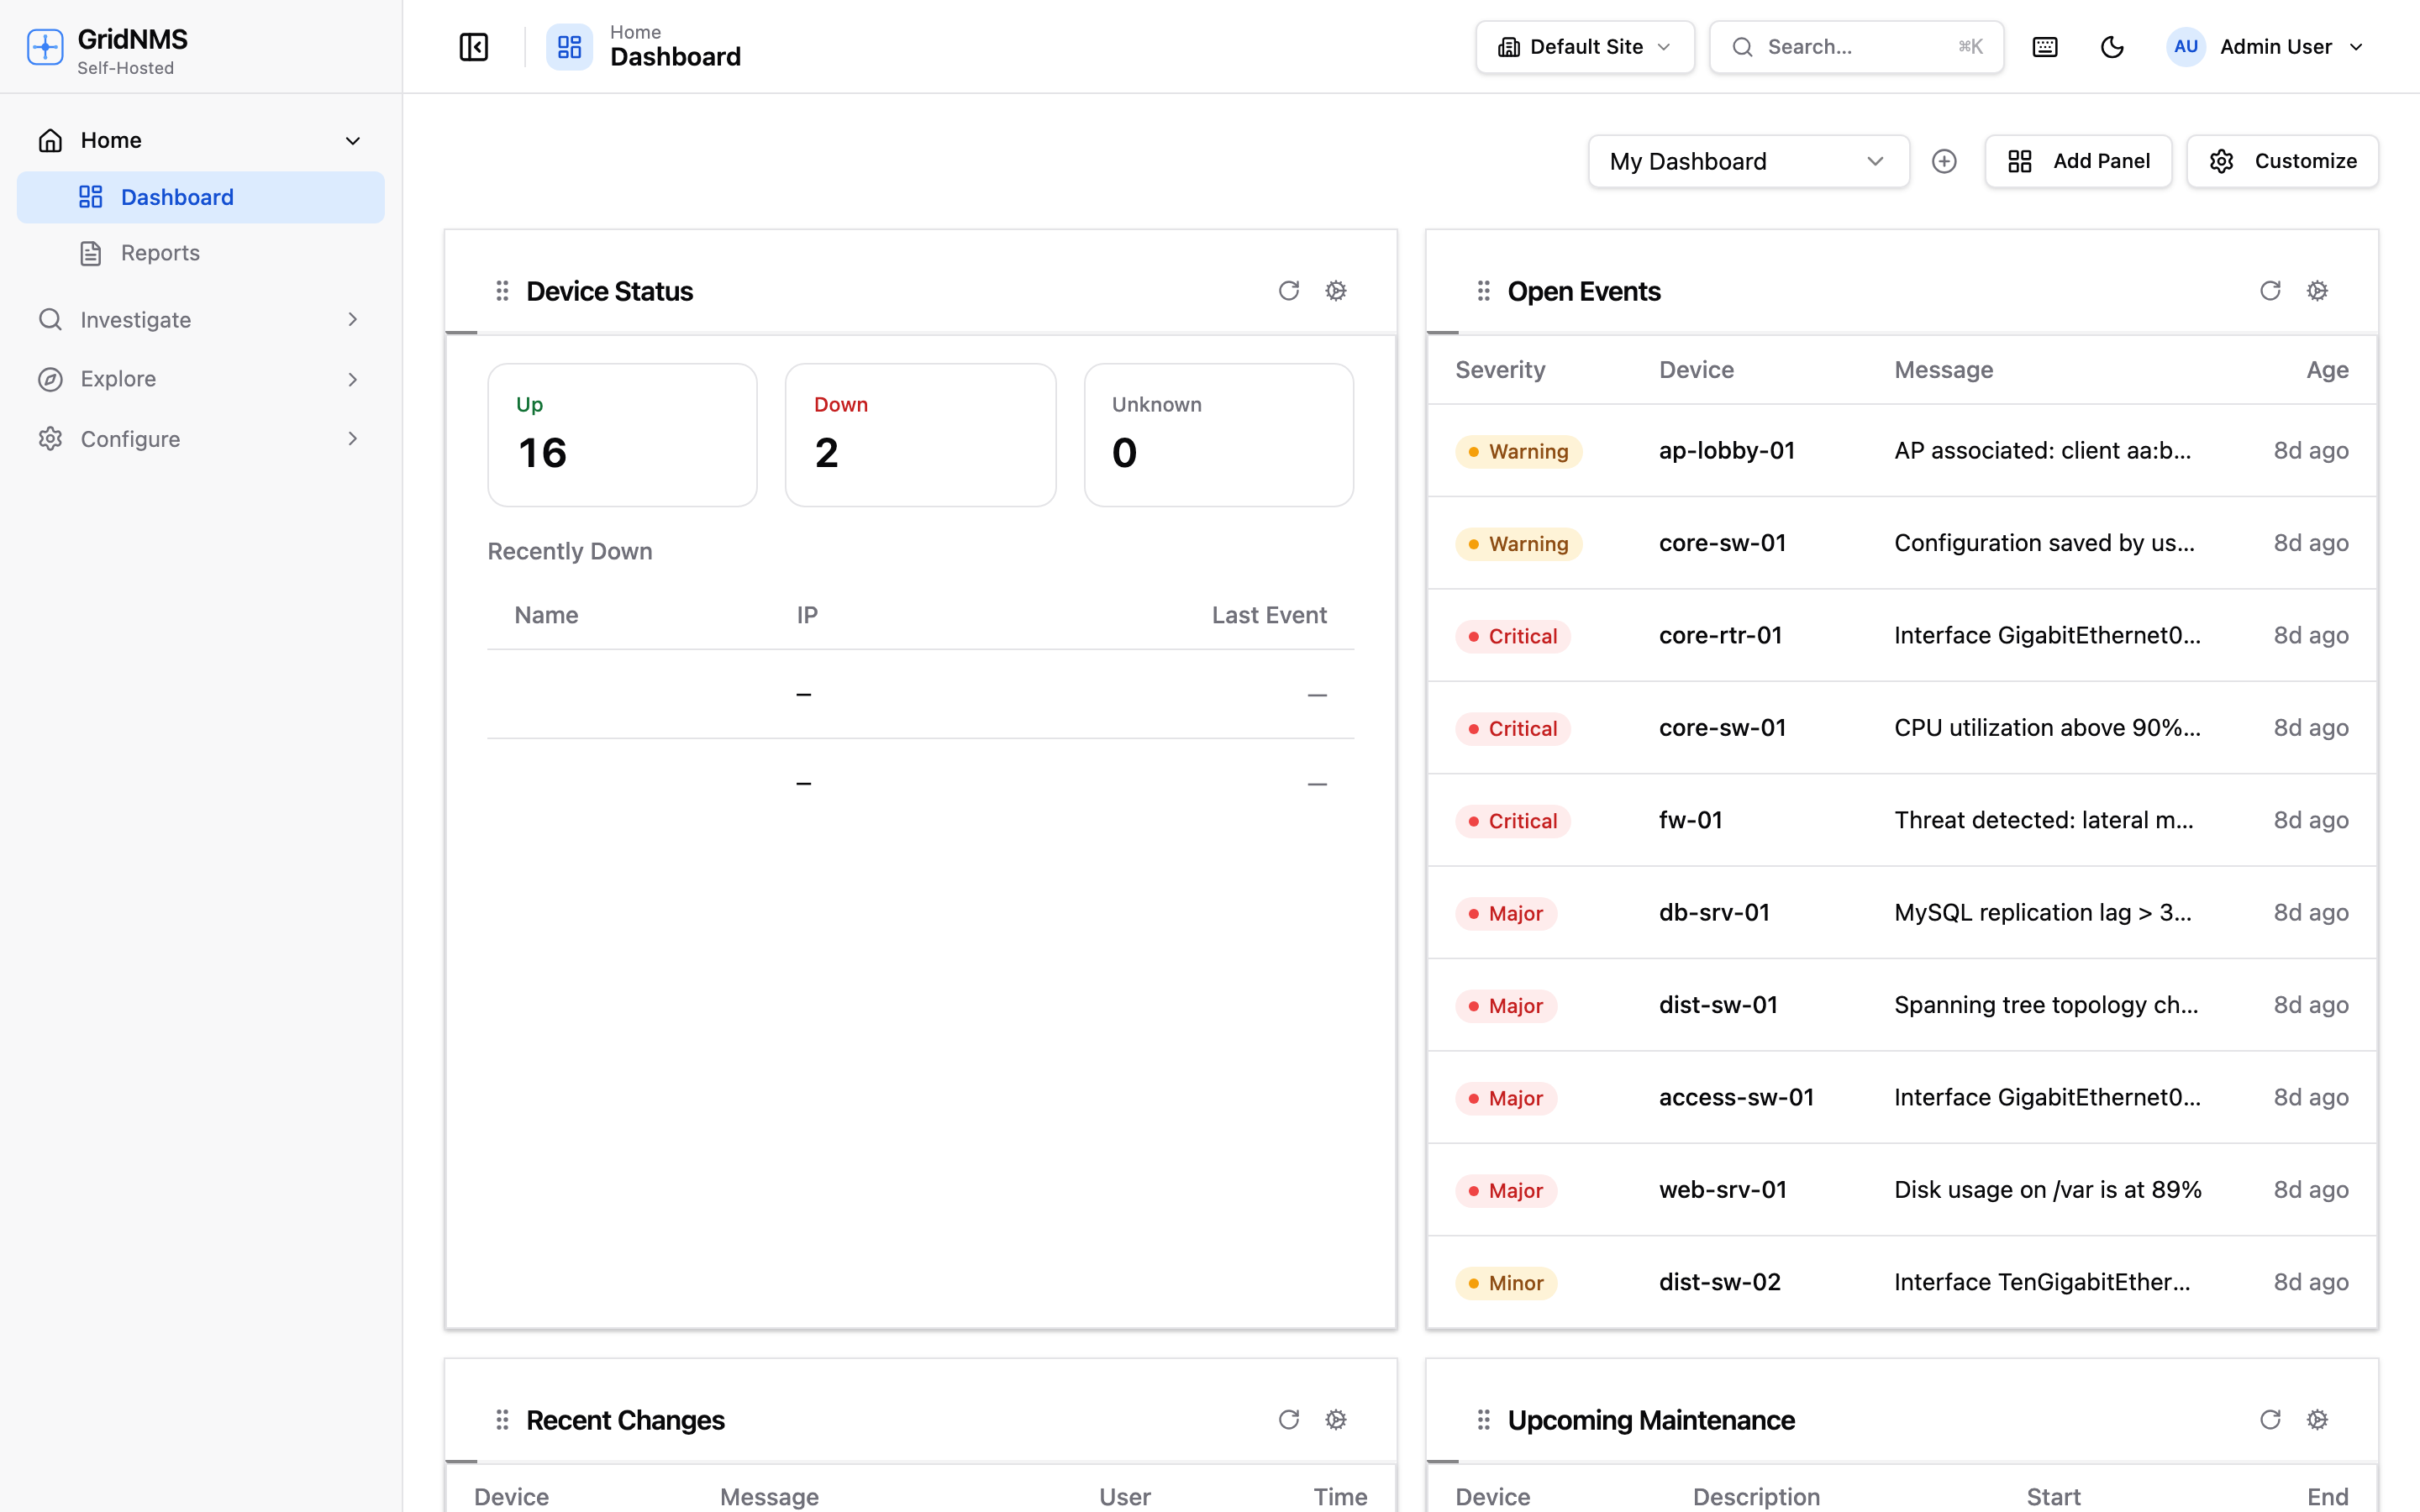 The dashboard updates automatically as your collector reports in.
You can rearrange panels, add new ones, and keep multiple saved dashboards — see The Dashboard.
6. Send your logs (optional)
Section titled “6. Send your logs (optional)”Point your devices’ syslog at your collector’s address to collect logs centrally. Then use Investigate → Log Search to search them, and set up detections to raise events automatically. See Logs & Detections and, importantly, Getting the Real Source IP.
7. Set up your first alert
Section titled “7. Set up your first alert”Decide what should reach you, and where.
- Go to Configure → Notification Endpoints and add a destination — an email address, a Slack channel, a webhook, or a PagerDuty service.
- Open a detection (Event Management → Detections) — or an interface bandwidth threshold — for the thing you want to be told about. The built-in Device down detection is a good first one.
- In its Notify section, turn on Notify on match, then choose Notify me and/or pick the endpoint you just created.
- Save. From now on, when that detection fires, the alert is delivered to your chosen destinations.
A worked example and all the options are in Notifications.
You’re up and running
Section titled “You’re up and running”From here, explore:
- Topology & Neighbors — see how your network connects.
- Events & Alerts — triage and tune what gets raised.
- Reports — inventory and event summaries for audits.